|
Copyright ©2018 by Paul Niquette. All rights reserved. |
|||||||||||||||||||||||||||||||||||||||||||||||||||||
Some Puzzles in the Skies
ask questions that seem to be simple (for large
values of "seem")...
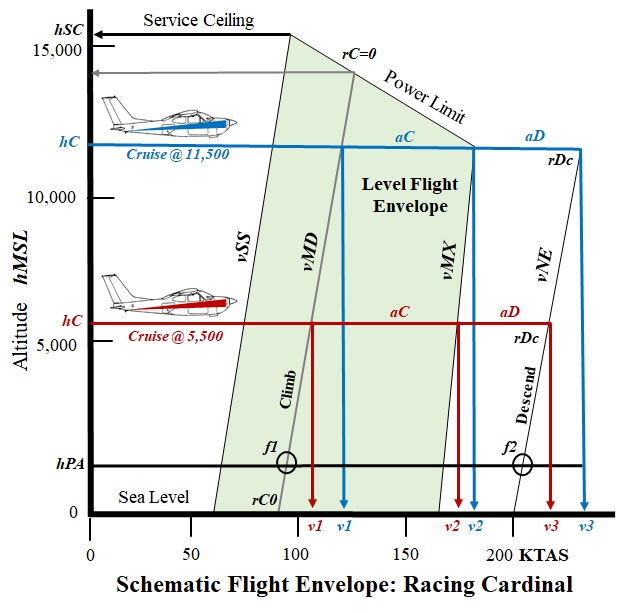 After take-off both planes fly alongside each other over f1 at hPA at t = 0. They begin ascending with a sea-level rate-of-climb rC ft/min (fpm), which must be adjusted for altitude by the expression... rC = rC0 + j h, where......with a true ground speed in still air given by the following expressions... vKTGS = vMD + k h, where k = 0.0023 kt/ftAt elapsed time t = 8 min, Red reaches cruise altitude h = 5,500 ft, ending the climb at v1 = 102 KTAS and quickly accelerating at aC within the level-flight envelope to cruise at v2 = 172 KTAS. At elapsed time t = 33 min, Blue reaches cruise altitude h = 11,500 ft, ending the climb at v1 = 115 KTAS and quickly accelerating at aC within the level-flight envelope to cruise at v2 = 180 KTAS. Nota bene, at that moment, t = 33 min, Red has flown 84 miles from fix f1 and is located 25 nm ahead of Blue, which has flown only 59 nm from fix f1. Let's call that ∆xMAX = 25 nm.The comparison below was produced with a spreadsheet, applying an elementary piece-wise linear model. It shows that the altitude versus time curve is concave downward. That is the result of the decreasing rate-of-climb rC with altitude -- despite the fact that true airspeed is actually increasing with altitude throughout the climb. Later in the flight, each plane will be operating outside the 'level-flight envelope' depicted above. Solvers will notice that to minimize flight time, true airspeeds, v3 and v3 are derived from 'never-exceed speed' vNE = 200 KIAS. 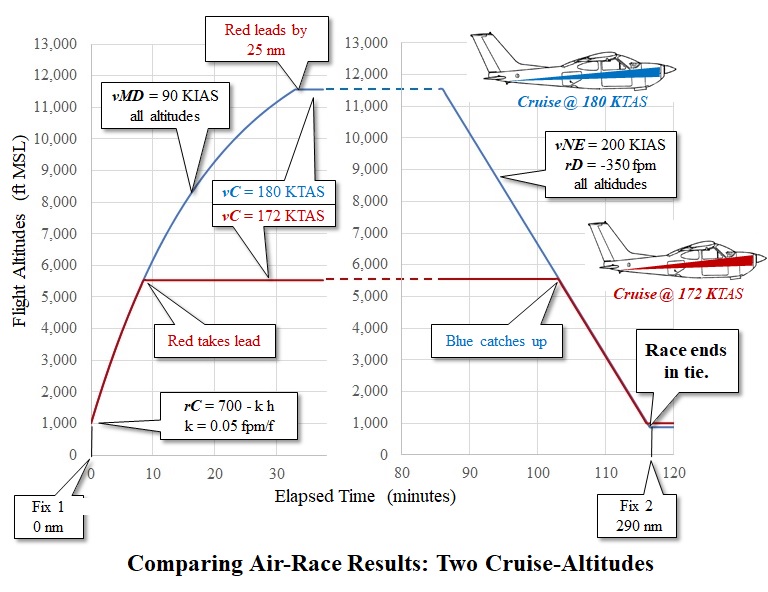
Instead,
at t = 86 min into the flight, Blue begins descending for
its arrival at f2. The plane
commences a high-speed 'shallow dive' at full power
from the cruise altitude hC
= 11,500 ft to hPA = 1,000 ft
MSL. As shown in the diagram above, the
descent uses an
assumed rate-of-descent rD = 350
fpm at all altitudes while adjusting pitch
to maintain the 'never-exceed speed' vNE
= 200 KIAS. Surprise! At t = 105 min, while descending through 5,500 ft MSL, Blue catches up with Red, which is just beginning its own shallow dive. Both planes will then reach Fix f2 11 minutes later, as one sees in the graph above at t = 116 min. Thus, the Air-Race ends in a tie.Sophisticated solvers are entitled to be suspicious that the puzzle was cooked up by the puzzle-master. Yet, there is at least one conclusion to be drawn from it: For such an Air-Race over a distance shorter than 290 nm, Red would win; for any distance longer than that, Blue wins. From the model we have discovered an interesting number for characterizing the performance comparison: ∆xMAX = 25 nm, which is the maximum distance by which one plane leads another in the Air-Race. It occurs just as the second plane reaches cruise altitude, from which we can calculate average speeds to reach that point: vAVG = 60 × 84 / 33 = 153 KTAS; vAVG = 60 × 59 / 33 = 107 KTAS. Reminder: Our model for the Air-Race postulated no wind. Of course, as a practical matter there is no such thing as 'no wind'. Whatever its intensity, from a breeze to a gale, 'winds aloft' have pronounced effects on flights in general and an Air-Race in particular. The graph below has been adapted from the solution to the Wind Circle puzzle. 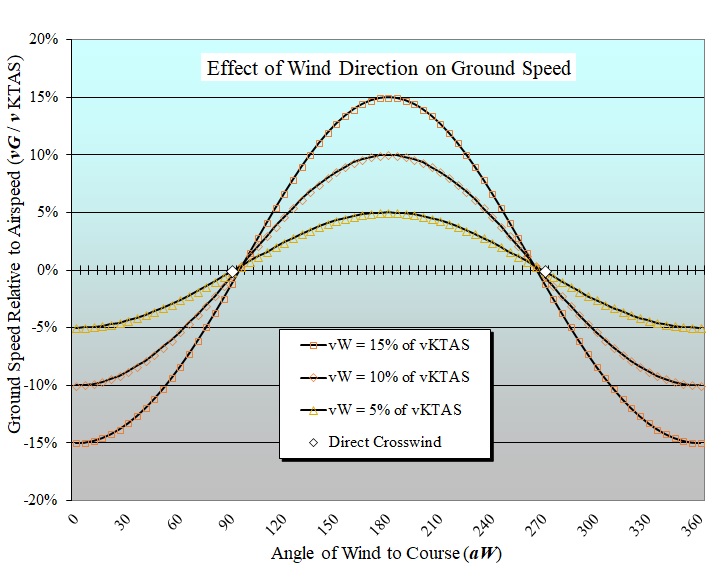 Consider the effect on the Air-Race of a hypothetical wind having a steady intensity vW and direction aW at all altitudes throughout the entire area. For cases of direct 'tailwind', aW = 180º, and we see in the graph that aircraft groundspeeds can be derived by adding vW in full measure to true airspeeds. For example, let vW = 18 kts, which happens to be 10% of Blue's cruise speed of 180 KTAS. If aW = 180º, then vG = 180 + 18 = 198 KTGS and vG = 172 + 18 = 190 KTGS. Likewise the average ground speeds calculated above will become: vAVG = 107 + 18 = 125 KTGS (+ 17%) and vAVG = 153 +18 = 171 KTGS (+ 12%). However, ∆xMAX = 25 nm does not change. Our hypothetical
wind in the model is hardly representative of winds
aloft. Indeed, vW
typically increases with altitude,
and, in the
northern hemisphere,
aW typically
rotates clockwise with altitude. Accordingly,
the decision about best cruise altitude in an Air-Race seems to be
dominated by winds aloft...
In the
table below are the performance results, using
'minimum drag speed' vMD = 90
KIAS for climbing at the beginning of the
hypothetical Air-Race.
In ordinary flying it is customary to trim for a
recommended 'cruise climb' speed vCC,
optimized for engine cooling and fuel economy.
To test the effects of a climb speed only slightly
faster than vMD, the
table shows that for a vCC = 95 KIAS,
the rate of climb decreases from 700 ft/min to 670
ft/min. Thus, the time to climb, say, 10,000
ft, increases from 31 min to 33 min. We
observe also that ∆xMAX increases from 25 nm to
27 nm.
* measured from 1,000 ft MSL to the respective cruise altitudes 5,500 ft and 11,500 ft MSL. During
the climb, if a tailwind is detected, the
solution to the Air-Race
puzzle calls for taking advantage of increases in
wind speed with altitude. The table shows that
climbing at vMD will hasten that
benefit.
|
|||||||||||||||||||||||||||||||||||||||||||||||||||||