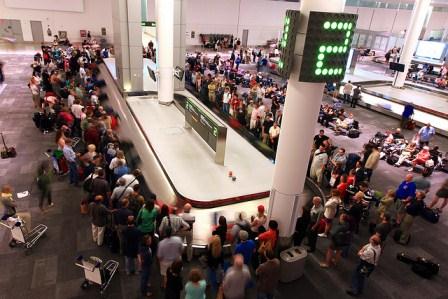
Claim Game 
Copyright ©2014 by Paul Niquette. All rights reserved.

Carousel

To stand and stare at stainless steel and floors of asphalt tile. 
No surprise to me, you seldom see passengers who smile.
Excerpt from Real Flying by Paul Niquette

Terminal Operations

Isn’t that a mighty ominous name for a department?  Hey, at an airline company?  Still, every airline must have a business unit responsible for baggage services: check-in and loading prior to departures, unloading and baggage claim upon arrival.  In the early ‘60s the ‘jet age’ was just – well, taking off.  Less than a quarter of Americans had ever flown.  Speed was in the air – but not only in the air.  Time was of the essence on the ground as well.  Flying at 500 mph was an exciting new experience for millions.  But what’s the point, if it takes an hour for checking in and another hour for baggage claim?

Though hardly as glamorous as flying, Terminal Operations are nevertheless necessary.  And costly.  Capital equipment for handling baggage calls for immense investments, and most functions are labor intensive as well.  For performance, the most demanding challenge is to provide prompt delivery of every piece of baggage to its owner after arrival.  Even with on-time departure and arrival, the time spent waiting for luggage is perceived by passengers as directly added to the duration of the flight.

Following arrival of each flight, there is a time required for passengers to flow out of the aircraft and make their way through the terminal to Baggage Claim.  Processing of baggage might be completed concurrently with that interval.  However that presumes a full complement of equipment and people-power idly standing by for instant deployment even as the airplane’s wheels are being chocked.  Meanwhile, what about the earliest passengers out the door?  They will surely be called upon to endure some amount of lingering after they get to Baggage Claim.  How much waiting time will be tolerated? 
Fifty years ago, that was the key question for Terminal Operations.
Grand Experiment
 
If asked, all passengers would say they want their luggage to be waiting for them in Baggage Claim with zero waiting time.  Best not ask.  A certain major airline had a statistician on staff in Terminal Operations who proposed a Grand Experiment.  The objective was to ascertain a realistic estimate for the time available after arrival of a typical aircraft for unloading and distributing baggage to passengers.  A statistical measurement of customer tolerance was needed.  Here is how the Grand Experiment worked. 

At airports, on selected flights, the Terminal Operations staff arranged to have all baggage secretly withheld from the arriving passengers.  Solvers may want to reread the previous sentence.  Luggage was withheld, that is, until there was an inquiry by one of the passengers.  Guided by the Terminal Operations staff at headquarters, the airline enlisted shift supervisors at each terminal to make clandestine measurements of the interval between when the plane arrived at the gate and the first passenger inquiry was received by an airline employee.  Baggage and suitcases would then be released, thence allowed to flow along conveyers and to slide onto the carousels to be claimed.

An hypothesis was formulated for the Grand Experiment.  In keeping with best practices, all assumptions were made explicit, including…
  • That all inquiries were documented as “complaints,”
  • That all responses were quick and courteous,
  • That 25 minutes would elapse before the last passengers arrived at Baggage Claim,
  • That  first inquiries complaints would be 'normally' distributed as indicated here…


Solver might be reminded that the Projected Distribution depicts the frequency of time intervals to first complaint among various flights, not some other distribution of complaints among passengers.  The instant the first complaint was recorded, the experiment for that flight was over. 

Thus, one sees that the hypothesis included 45 minutes for the average time to first complaint.  Some flights would have shorter than average intervals, others longer than average.  Various factors were considered to be relevant to those deviations.  Solvers are here given the opportunity to see a representation of the Actual Distribution from data produced by the Grand Experiment…


Hmm.  The Actual Distribution turned out to be “bimodal”!  Solvers will observe the exclamatory punctuation at the end of the previous sentence and this one!
  • The first 'mode' signifies that many flights had intervals-to-first-complaint averaging 45 minutes, which agrees with the Projected Distribution.
  • In the Actual Distribution, however, some flights showed a remarkable tolerance by passengers, with a second 'mode' at more than an hour.  

That all came as a complete surprise to the statistician in Terminal Operations.  It was good news, though.  The indicated shift would surely grant extra time for baggage delivery.  But its cause was something of a mystery...
 
What is your explanation? 
1.     Length of Flight................................... Longer vs Shorter
2.     Destination Airport............ North vs South,  East vs West
3.     Arrival Time.....Daytime vs Nighttime, Evening vs Morning
4.     Season .....................Summer vs Winter, Spring vs Autumn
5.     Weather ..................................Hot vs Cold, Rain vs Shine
6.     Something Else


GO TO SOLUTION PAGE